OLLI WORKSHOP ON COMPUTERS VERSUS HUMANS
Second Sets of Visuals (September
21, 2010)
Copyright ©2010 by Theo Pavlidis
|
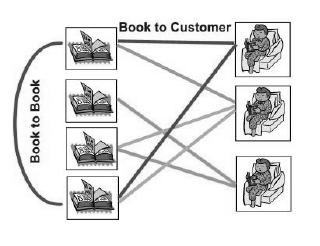
How Amazon matches books to readers
(Collaborative Filtering)
|
Using Ratings from Several Users to Predict New Ratings
| User Ratings for Two Items |
| User |
Item 1 |
Item 2 |
| John |
4 |
5 |
| Richard |
4 |
4 |
| Tiffany |
2 |
3 |
| Lucy |
4 |
3 |
| Michael |
5 |
4 |
| Basil |
4 |
3 |
| Betty |
3 |
3 |
|
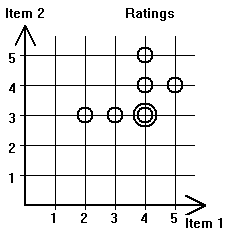 Data of the Table as a Graph
 |
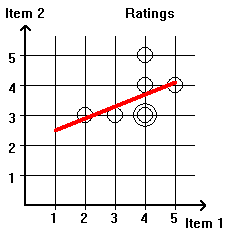
Regression Line |
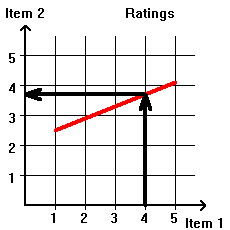 Using the Regression Line
 |
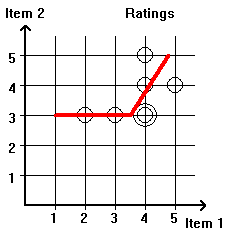 Piecewine Linear Regression
 |
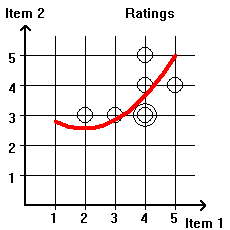 Parabolic Regression
 |
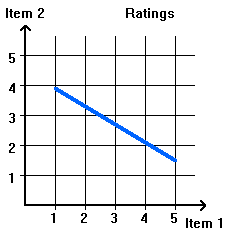 Opposite
Ratings Opposite
Ratings |
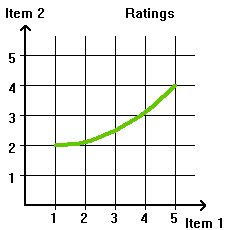 A Regression
Curve and its use .... A Regression
Curve and its use .... |
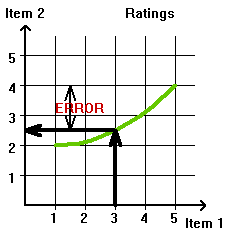 to measure
error between prediction and reality. to measure
error between prediction and reality. |
Distance between Users |
| Distance(U1, U2) = |R1(A)-R2(A)| + |R1(B)-R2(B)|
+ ... + |R1(X)-R2(X)| + ....
|
| Distance(John, Richard) |
0 + 1 = 1 |
Distance(Tiffany, Lucy) |
2 + 0 = 2 |
| Distance(John, Tiffany) |
2 + 2 = 4 |
Distance(Tiffany, Michael) |
3 + 1 = 4 |
| Distance(John, Lucy) |
0 + 2 = 2 |
Distance(Tiffany, Basil) |
2 + 0 = 2 |
| Distance(John, Michael) |
1 + 1 = 2 |
Distance(Tiffany, Betty) |
1 + 0 = 1 |
| Distance(John, Basil) |
0 + 2 = 2 |
Distance(Lucy, Michael) |
1 + 1 = 2 |
| Distance(John, Betty) |
1 + 2 = 3 |
Distance(Lucy, Basil) |
0 + 0 = 0 |
| Distance(Richard, Tiffany) |
2 + 1 = 3 |
Distance(Lucy, Betty) |
1 + 0 = 0 |
| Distance(Richard, Lucy) |
0 + 1 = 1 |
Distance(Michael, Basil) |
1 + 1 = 2 |
| Distance(Richard, Michael) |
1+ 0 = 1 |
Distance(Michael, Betty) |
2 + 1 = 3 |
| Distance(Richard, Basil) |
0 + 1 = 1 |
Distance(Basil, Betty) |
1 + 0 = 1 |
| Distance(Richard, Betty) |
1 + 1 = 2 |
|
|
|