2.2. USING RATINGS - THE REGRESSION LINE
The Basis of the Method
We can improve upon the recommendations if we have available user ratings of a product rather than only sales information. Many web merchants let users rate items, most often by assigning from one to five stars. The are many mathematical methods in use for making recommendations for new products based on such ratings.
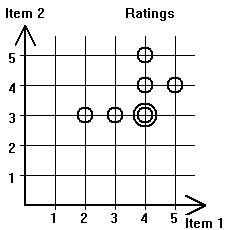
One way is to relate the ratings between two items. Table 2.2.1 below shows an example of ratings of two items by several users. Suppose we have a new user, say, Mary and she has rated item 1 with 4 stars. Can we guess what will be her rating for item 2? If we can do that and the rating is high, then we can recommend item 2 to Mary. On the right of the table we have drawn a graph of the ratings and that may help us make the prediction.
|
| |||||||||||||||||||||||||||
| Figure 2.2.1: Graphical representation of the table of user ratings. The double circle at ratings 4 for item 1 and 3 for item 2 means that two users gave that particular combination of ratings. | ||||||||||||||||||||||||||||
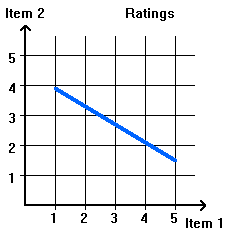
We can draw a straight line that marks the relationship between the marked points in FIgure 2.2.1 and such a line is shown in red in Figure 2.2.2 (a). It is called the regression line and there are well establish ways for computing it. (See [1]or [2] for an explanation of how to compute such a line. In our particular case the slope is about 0.4 and the vertical intercept 2.1.) From that line we can guess that Mary's rating for item 2 will be 3.7. The construction is shown in Figure 2.2.2(b). This rating is high enough to warrantee a recommendation of item 2 for Mary.
 |
 |
| (a) | (b) |
| Figure 2.2.2: Regression Line for the rating of Figure 2.2.1. (a) The construction of the line; (b) How the line can be used to predict the preference of a user. | |
The regression line tells us something about the relationship between the ratings. In the example of Figure 2.2.2 the line has a low slope reflecting the fact that users gave a smaller range of rating to item 2 (from 3 to 5 versus 2 to 5 for item 1). The slope is positive (explain) reflecting the fact the users tended to give similar ratings to both items. If all user rate the second item a little lower than the first, we have a line such as in Figure 2.2.3(a). This might be the case for movies if item 2 is a sequel to item 1. Finally, Figure 2.2.3(b) illustrates a case where opinions for the two items are in opposition. This might happen if one is a violent adventure movie and the other a romantic story.
 |
 |
| (a) | (b) |
| Figure 2.2.3: Relating the ratings of one item versus that of another. Examples of regression lines. | |
Machine Learning and the Netflix Challenge
Finding the regression line between two items for a group of users is sometimes called Machine Learning. The Computer "learns" to relate the tastes of users for each of the two items. Finding the regression line is the simplest way of predicting the tastes of users. One could draw a more complex curve relating the tastes of users for the two items. Examples are shown in Figure 2.2.4.
 |
 |
| (a) | (b) |
| Figure 2.2.4: Examples of relations between user ratings for two items that are expressed by more complex curves than a straight line. | |
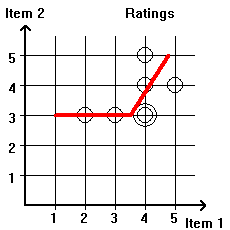
In Figure 2.2.4a we fit the data of Figure 2.2.1 with two line segments (a polyline) rather than a single line. By using a polyline rather than a straight line we have more variables to work with and we can get a closer fit to the data. In Figure 2.2.4b we fit the same data with a curve (a parabola to be precise). Again, the fit is better than that of Figure 2.2.2.
Clearly, it pays to look for more complex relationships between ratings than that given by a straight line and this was the objective of the Netflix Challenge. Netflix is a company that rents out DVDs and also provides similar services over the Internet. When someone orders a movie the company recommends other movies that this person might like. Users rate movies by assigning from one to five stars and the company uses these ratings to guess what a particular person might like. In 2007 the company announced that it offered a million dollar prize to anyone that could improve upon its own system for predicting user tastes. The company made public data from the ratings of past users that could be used by those trying to meet the challenge.
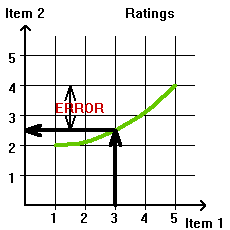
The established way for applying Machine Learning to such data is to split the data into two parts, a design set and a test set. (Typically each part has the same number of users but this need not be so.) The data from the design set are used to find a curve that fit the ratings for the two items (shown in green in Figure 2.2.5(a)). Then the ratings for the first item from the test data are used to find the ratings of the second item using the curve found from the design set by the process illustrated in Figure 2.2.2(b). Next, the predicted ratings are compared to the actual ratings of item 2 by the test set users. This is shown in Figure 2.2.5(b).
 |
 |
| (a) | (b) |
| Figure 2.2.5: A user from the test set has rated item 1 with 3 and item 2 with 4. The predicted value from the green curve is 2.5 so the error of the prediction is 1.5 | |
A measure of the errors found from the predictions of users in the test can then be used to evaluate how good the predictions are. If the designers are not satisfied with the results they can try to fit a different curve to the data and repeat the process. There are various ways to refine the process and we will describe them in the Section 2.4 where we also continue the discussion of the Netflix Challenge. But first we will take a look on Machine Learning.
Notes
[1] http://people.hofstra.edu/Stefan_Waner/calctopic1/regression.html - a discussion of finding the regression line with a lot of explanations.
[2] http://alliance.seas.upenn.edu/~cis520/wiki/index.php?n=Lectures.Regression - a discussion of the regression line that is more concise than [1].