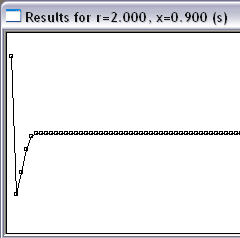
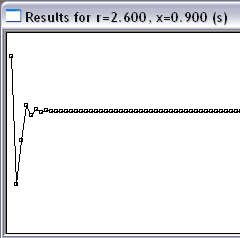
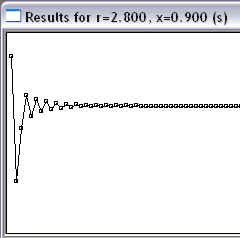
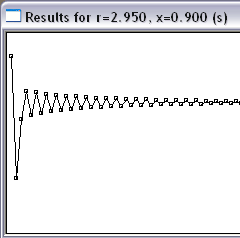
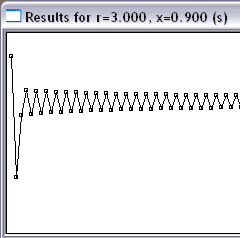
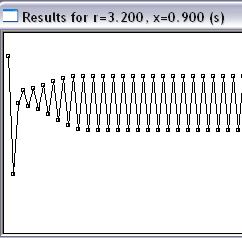
Figure 1: Plots of the changes in the population of fish for about 50 generations. As r increases the transition to equilibrium takes longer and eventually the equilibrium is never reached but the population keeps flactuating between two values.
|
|
Figure 1: Plots of the changes in the population of fish for about 50 generations. As r increases the transition to equilibrium takes longer and eventually the equilibrium is never reached but the population keeps flactuating between two values. |
|
|
|
|
|