|
|
|
|
|
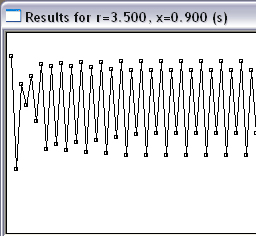
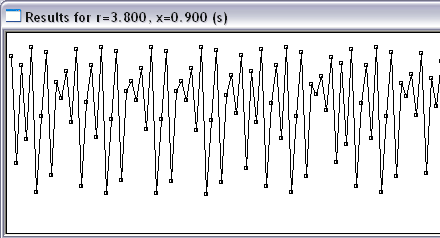
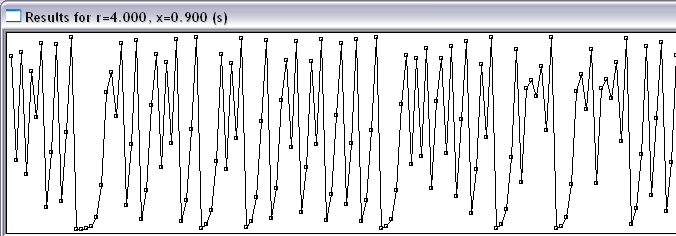
| Figure 2: A regular pattern of fluctuations can be seen on the top left diagram (r equal to 3.5) but it is harder to discern the pattern in the top right diagram (r equal to 3.8). No pattern can be found in the bottom diagram (r equal to 4.0) and we call that behavior chaotic. | |